Note
Go to the end to download the full example code.
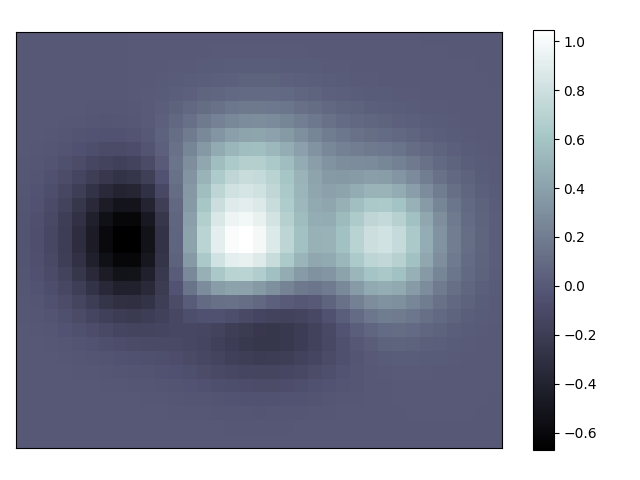
Imshow elaborate
An example demoing imshow and styling the figure.
import numpy as np
import matplotlib.pyplot as plt


def f(x, y):
    return (1 - x / 2 + x**5 + y**3) * np.exp(-(x**2) - y**2)


n = 10
x = np.linspace(-3, 3, int(3.5 * n))
y = np.linspace(-3, 3, int(3.0 * n))
X, Y = np.meshgrid(x, y)
Z = f(X, Y)

plt.axes((0.025, 0.025, 0.95, 0.95))
plt.imshow(Z, interpolation="nearest", cmap="bone", origin="lower")
plt.colorbar(shrink=0.92)

plt.xticks([])
plt.yticks([])
plt.show()
Total running time of the script: (0 minutes 0.076 seconds)