Note
Go to the end to download the full example code.
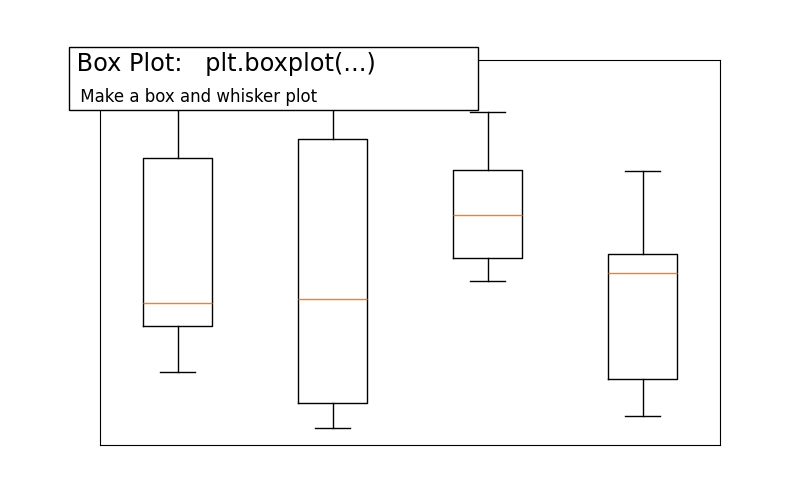
Boxplot with matplotlib
An example of doing box plots with matplotlib
import numpy as np
import matplotlib.pyplot as plt


fig = plt.figure(figsize=(8, 5))
axes = plt.subplot(111)

n = 5
Z = np.zeros((n, 4))
X = np.linspace(0, 2, n)
rng = np.random.default_rng()
Y = rng.random((n, 4))
plt.boxplot(Y)

plt.xticks([])
plt.yticks([])


# Add a title and a box around it
from matplotlib.patches import FancyBboxPatch

ax = plt.gca()
ax.add_patch(
    FancyBboxPatch(
        (-0.05, 0.87),
        width=0.66,
        height=0.165,
        clip_on=False,
        boxstyle="square,pad=0",
        zorder=3,
        facecolor="white",
        alpha=1.0,
        transform=plt.gca().transAxes,
    )
)

plt.text(
    -0.05,
    1.02,
    " Box Plot:   plt.boxplot(...)\n ",
    horizontalalignment="left",
    verticalalignment="top",
    size="xx-large",
    transform=axes.transAxes,
)

plt.text(
    -0.04,
    0.98,
    "\n Make a box and whisker plot ",
    horizontalalignment="left",
    verticalalignment="top",
    size="large",
    transform=axes.transAxes,
)

plt.show()
Total running time of the script: (0 minutes 0.040 seconds)