Note
Go to the end to download the full example code.
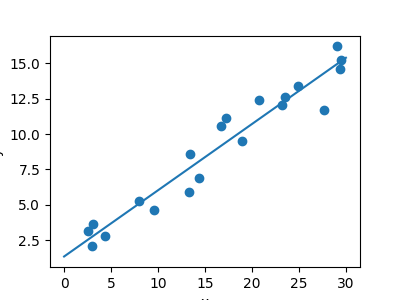
3.4.8.3. A simple linear regression
import numpy as np
import matplotlib.pyplot as plt
from sklearn.linear_model import LinearRegression

# x from 0 to 30
rng = np.random.default_rng()
x = 30 * rng.random((20, 1))

# y = a*x + b with noise
y = 0.5 * x + 1.0 + rng.normal(size=x.shape)

# create a linear regression model
model = LinearRegression()
model.fit(x, y)

# predict y from the data
x_new = np.linspace(0, 30, 100)
y_new = model.predict(x_new[:, np.newaxis])

# plot the results
plt.figure(figsize=(4, 3))
ax = plt.axes()
ax.scatter(x, y)
ax.plot(x_new, y_new)

ax.set_xlabel("x")
ax.set_ylabel("y")

ax.axis("tight")


plt.show()
Total running time of the script: (0 minutes 0.048 seconds)