Note
Go to the end to download the full example code.
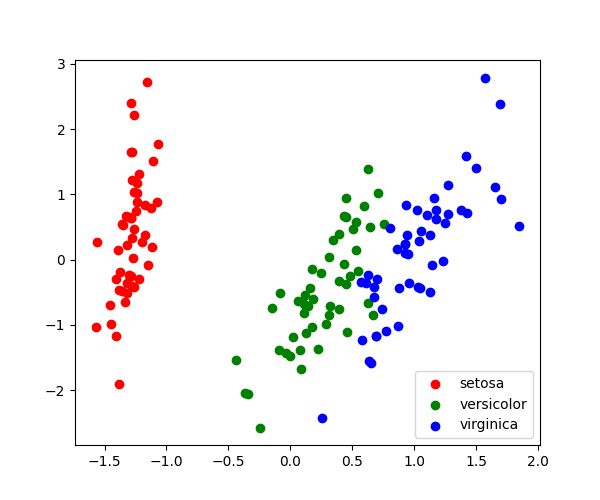
3.4.8.1. Demo PCA in 2D
Load the iris data
from sklearn import datasets

iris = datasets.load_iris()
X = iris.data
y = iris.target
Fit a PCA
Project the data in 2D
X_pca = pca.transform(X)
Visualize the data
target_ids = range(len(iris.target_names))

import matplotlib.pyplot as plt

plt.figure(figsize=(6, 5))
for i, c, label in zip(target_ids, "rgbcmykw", iris.target_names, strict=False):
    plt.scatter(X_pca[y == i, 0], X_pca[y == i, 1], c=c, label=label)
plt.legend()
plt.show()
Total running time of the script: (0 minutes 0.101 seconds)