Note
Go to the end to download the full example code.
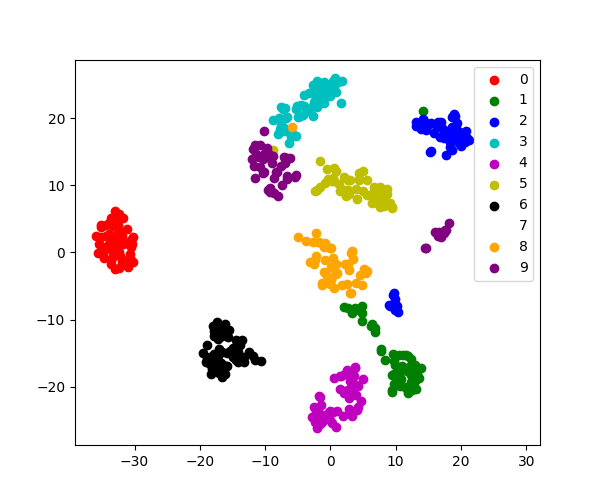
3.4.8.5. tSNE to visualize digits
Here we use sklearn.manifold.TSNE to visualize the digits
datasets. Indeed, the digits are vectors in a 8*8 = 64 dimensional space.
We want to project them in 2D for visualization. tSNE is often a good
solution, as it groups and separates data points based on their local
relationship.
Load the iris data
from sklearn import datasets

digits = datasets.load_digits()
# Take the first 500 data points: it's hard to see 1500 points
X = digits.data[:500]
y = digits.target[:500]
Fit and transform with a TSNE
Project the data in 2D
Visualize the data
target_ids = range(len(digits.target_names))

import matplotlib.pyplot as plt

plt.figure(figsize=(6, 5))
colors = "r", "g", "b", "c", "m", "y", "k", "w", "orange", "purple"
for i, c, label in zip(target_ids, colors, digits.target_names, strict=True):
    plt.scatter(X_2d[y == i, 0], X_2d[y == i, 1], c=c, label=label)
plt.legend()
plt.show()
Total running time of the script: (0 minutes 1.217 seconds)