Note
Go to the end to download the full example code.
Example: Masked statistics
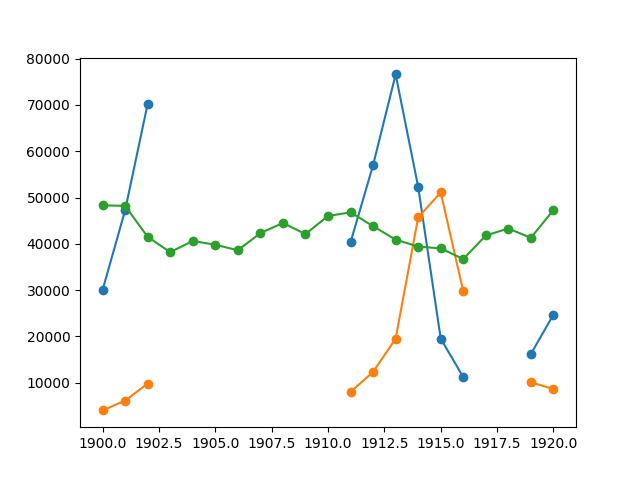
Plot a masked statistics
import numpy as np
import matplotlib.pyplot as plt

data = np.loadtxt("../../../../data/populations.txt")
populations = np.ma.masked_array(data[:, 1:])  # type: ignore[var-annotated]
year = data[:, 0]

bad_years = ((year >= 1903) & (year <= 1910)) | ((year >= 1917) & (year <= 1918))
populations[bad_years, 0] = np.ma.masked
populations[bad_years, 1] = np.ma.masked

plt.plot(year, populations, "o-")
plt.show()
Total running time of the script: (0 minutes 0.058 seconds)