Note
Go to the end to download the full example code.
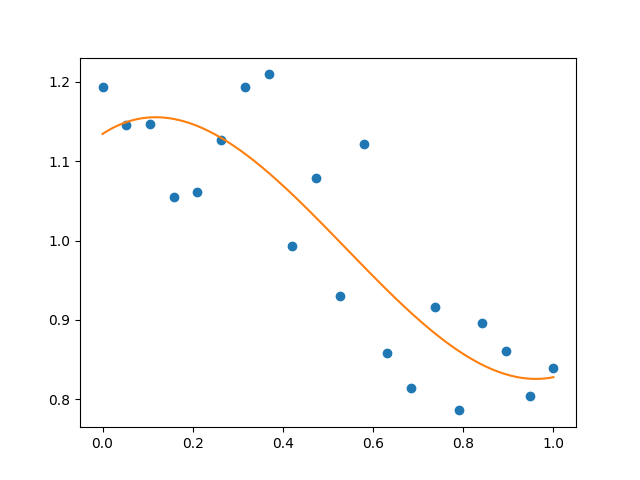
Fitting to polynomial
Plot noisy data and their polynomial fit
import numpy as np
import matplotlib.pyplot as plt

rng = np.random.default_rng(27446968)

x = np.linspace(0, 1, 20)
y = np.cos(x) + 0.3 * rng.random(20)
p = np.poly1d(np.polyfit(x, y, 3))

t = np.linspace(0, 1, 200)
plt.plot(x, y, "o", t, p(t), "-")
plt.show()
Total running time of the script: (0 minutes 0.046 seconds)