Note
Go to the end to download the full example code.
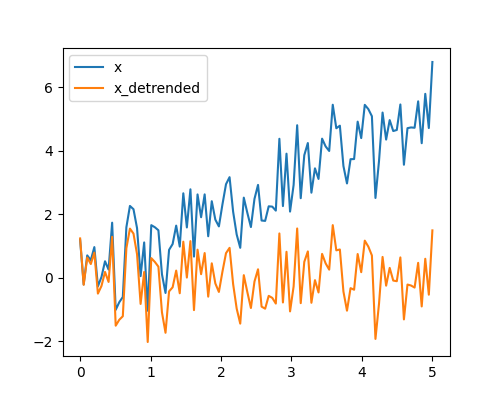
1.5.12.3. Detrending a signal
scipy.signal.detrend() removes a linear trend.
Generate a random signal with a trend
import numpy as np

t = np.linspace(0, 5, 100)
rng = np.random.default_rng()
x = t + rng.normal(size=100)
Detrend
import scipy as sp

x_detrended = sp.signal.detrend(x)
Plot
import matplotlib.pyplot as plt

plt.figure(figsize=(5, 4))
plt.plot(t, x, label="x")
plt.plot(t, x_detrended, label="x_detrended")
plt.legend(loc="best")
plt.show()
Total running time of the script: (0 minutes 0.051 seconds)