Note
Go to the end to download the full example code.
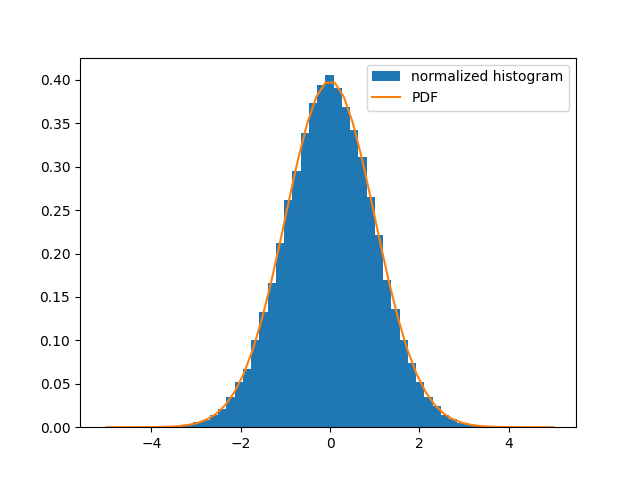
1.5.12.5. Normal distribution: histogram and PDF
Explore the normal distribution: a histogram built from samples and the PDF (probability density function).
import numpy as np
import scipy as sp
import matplotlib.pyplot as plt

dist = sp.stats.norm(loc=0, scale=1)  # standard normal distribution
sample = dist.rvs(size=100000)  # "random variate sample"
plt.hist(
    sample,
    bins=51,  # group the observations into 50 bins
    density=True,  # normalize the frequencies
    label="normalized histogram",
)

x = np.linspace(-5, 5)  # possible values of the random variable
plt.plot(x, dist.pdf(x), label="PDF")
plt.legend()
plt.show()
Total running time of the script: (0 minutes 0.096 seconds)