Note
Go to the end to download the full example code.
Crude periodicity finding
Discover the periods in evolution of animal populations
(../../../../data/populations.txt)
Load the data
import numpy as np

data = np.loadtxt("../../../../data/populations.txt")
years = data[:, 0]
populations = data[:, 1:]
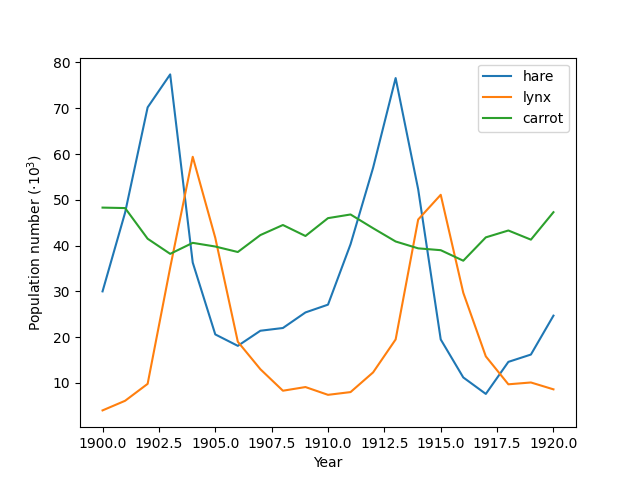
Plot the data
import matplotlib.pyplot as plt

plt.figure()
plt.plot(years, populations * 1e-3)
plt.xlabel("Year")
plt.ylabel(r"Population number ($\cdot10^3$)")
plt.legend(["hare", "lynx", "carrot"], loc=1)
<matplotlib.legend.Legend object at 0x7f3b2b8c5370>
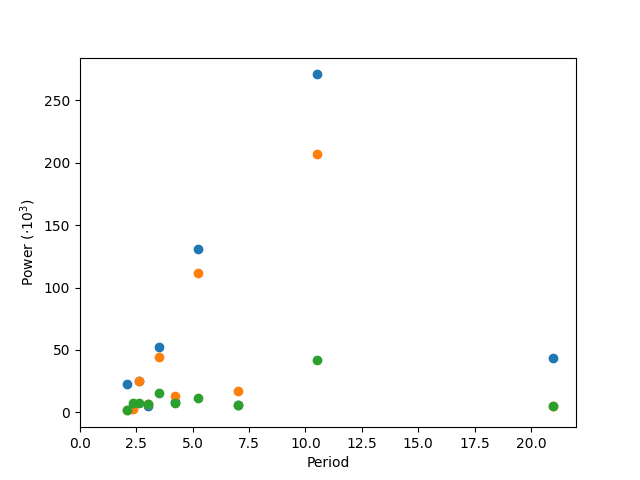
Plot its periods
import scipy as sp

ft_populations = sp.fft.fft(populations, axis=0)
frequencies = sp.fft.fftfreq(populations.shape[0], years[1] - years[0])
periods = 1 / frequencies

plt.figure()
plt.plot(periods, abs(ft_populations) * 1e-3, "o")
plt.xlim(0, 22)
plt.xlabel("Period")
plt.ylabel(r"Power ($\cdot10^3$)")

plt.show()
/home/runner/work/scientific-python-lectures/scientific-python-lectures/intro/scipy/examples/solutions/plot_periodicity_finder.py:39: RuntimeWarning: divide by zero encountered in divide
  periods = 1 / frequencies
There’s probably a period of around 10 years (obvious from the plot), but for this crude a method, there’s not enough data to say much more.
Total running time of the script: (0 minutes 0.129 seconds)