Note
Go to the end to download the full example code.
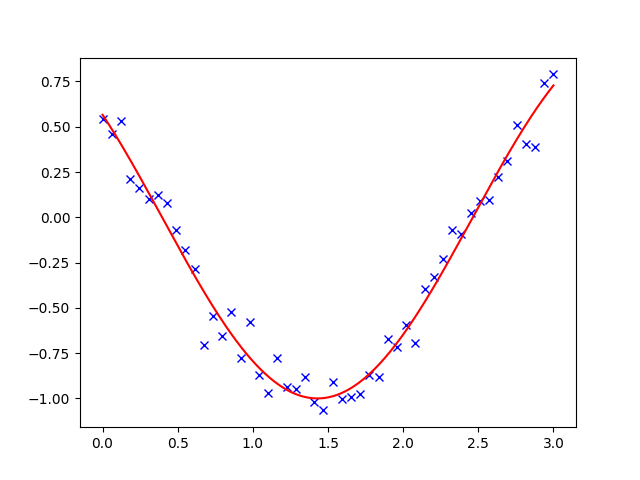
2.7.4.3. Curve fitting
A curve fitting example
import numpy as np
import scipy as sp
import matplotlib.pyplot as plt

rng = np.random.default_rng(27446968)


# Our test function
def f(t, omega, phi):
    return np.cos(omega * t + phi)


# Our x and y data
x = np.linspace(0, 3, 50)
y = f(x, 1.5, 1) + 0.1 * np.random.normal(size=50)

# Fit the model: the parameters omega and phi can be found in the
# `params` vector
params, params_cov = sp.optimize.curve_fit(f, x, y)

# plot the data and the fitted curve
t = np.linspace(0, 3, 1000)

plt.figure(1)
plt.clf()
plt.plot(x, y, "bx")
plt.plot(t, f(t, *params), "r-")
plt.show()
Total running time of the script: (0 minutes 0.053 seconds)