Note
Go to the end to download the full example code.
2.7.4.2. Smooth vs non-smooth
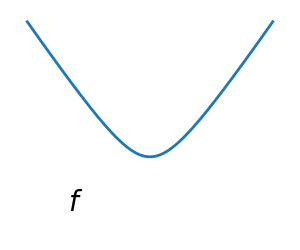
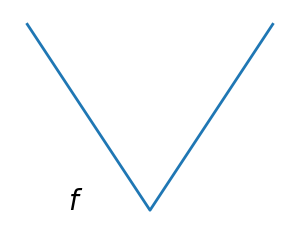
Draws a figure to explain smooth versus non smooth optimization.
import numpy as np
import matplotlib.pyplot as plt

x = np.linspace(-1.5, 1.5, 101)

# A smooth function
plt.figure(1, figsize=(3, 2.5))
plt.clf()

plt.plot(x, np.sqrt(0.2 + x**2), linewidth=2)
plt.text(-1, 0, "$f$", size=20)

plt.ylim(ymin=-0.2)
plt.axis("off")
plt.tight_layout()

# A non-smooth function
plt.figure(2, figsize=(3, 2.5))
plt.clf()
plt.plot(x, np.abs(x), linewidth=2)
plt.text(-1, 0, "$f$", size=20)

plt.ylim(ymin=-0.2)
plt.axis("off")
plt.tight_layout()
plt.show()
Total running time of the script: (0 minutes 0.038 seconds)