Note
Go to the end to download the full example code.
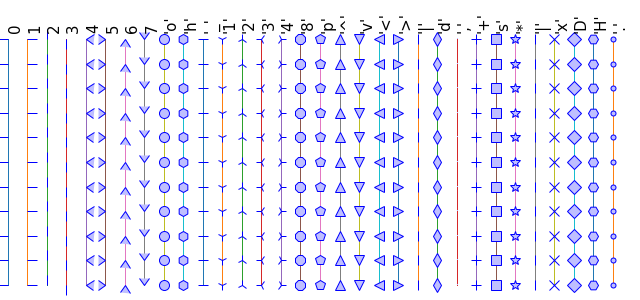
Markers
Show the different markers of matplotlib.
import numpy as np
import matplotlib.pyplot as plt


def marker(m, i):
    X = i * 0.5 * np.ones(11)
    Y = np.arange(11)

    plt.plot(X, Y, lw=1, marker=m, ms=10, mfc=(0.75, 0.75, 1, 1), mec=(0, 0, 1, 1))
    plt.text(0.5 * i, 10.25, repr(m), rotation=90, fontsize=15, va="bottom")


markers = [
    0,
    1,
    2,
    3,
    4,
    5,
    6,
    7,
    "o",
    "h",
    "_",
    "1",
    "2",
    "3",
    "4",
    "8",
    "p",
    "^",
    "v",
    "<",
    ">",
    "|",
    "d",
    ",",
    "+",
    "s",
    "*",
    "|",
    "x",
    "D",
    "H",
    ".",
]

n_markers = len(markers)

size = 20 * n_markers, 300
dpi = 72.0
figsize = size[0] / float(dpi), size[1] / float(dpi)
fig = plt.figure(figsize=figsize, dpi=dpi)
plt.axes((0, 0.01, 1, 0.9), frameon=False)

for i, m in enumerate(markers):
    marker(m, i)

plt.xlim(-0.2, 0.2 + 0.5 * n_markers)
plt.xticks([])
plt.yticks([])

plt.show()
Total running time of the script: (0 minutes 0.071 seconds)