Note
Go to the end to download the full example code.
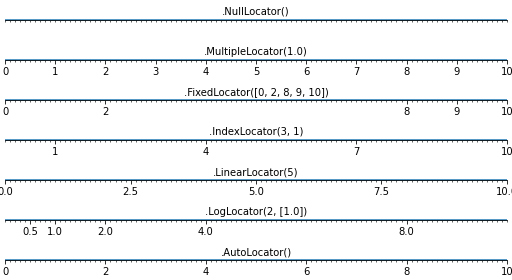
Locators for tick on axis
An example demoing different locators to position ticks on axis for matplotlib.
import numpy as np

from matplotlib import ticker
import matplotlib.pyplot as plt


def tickline():
    plt.xlim(0, 10), plt.ylim(-1, 1), plt.yticks([])
    ax = plt.gca()
    ax.spines["right"].set_color("none")
    ax.spines["left"].set_color("none")
    ax.spines["top"].set_color("none")
    ax.xaxis.set_ticks_position("bottom")
    ax.spines["bottom"].set_position(("data", 0))
    ax.yaxis.set_ticks_position("none")
    ax.xaxis.set_minor_locator(ticker.MultipleLocator(0.1))
    ax.plot(np.arange(11), np.zeros(11))
    return ax


locators = [
    "ticker.NullLocator()",
    "ticker.MultipleLocator(1.0)",
    "ticker.FixedLocator([0, 2, 8, 9, 10])",
    "ticker.IndexLocator(3, 1)",
    "ticker.LinearLocator(5)",
    "ticker.LogLocator(2, [1.0])",
    "ticker.AutoLocator()",
]

n_locators = len(locators)

size = 512, 40 * n_locators
dpi = 72.0
figsize = size[0] / float(dpi), size[1] / float(dpi)
fig = plt.figure(figsize=figsize, dpi=dpi)
fig.patch.set_alpha(0)


for i, locator in enumerate(locators):
    plt.subplot(n_locators, 1, i + 1)
    ax = tickline()
    ax.xaxis.set_major_locator(eval(locator))
    plt.text(5, 0.3, locator[7:], ha="center")

plt.subplots_adjust(bottom=0.01, top=0.99, left=0.01, right=0.99)
plt.show()
Total running time of the script: (0 minutes 0.879 seconds)