Note
Go to the end to download the full example code.
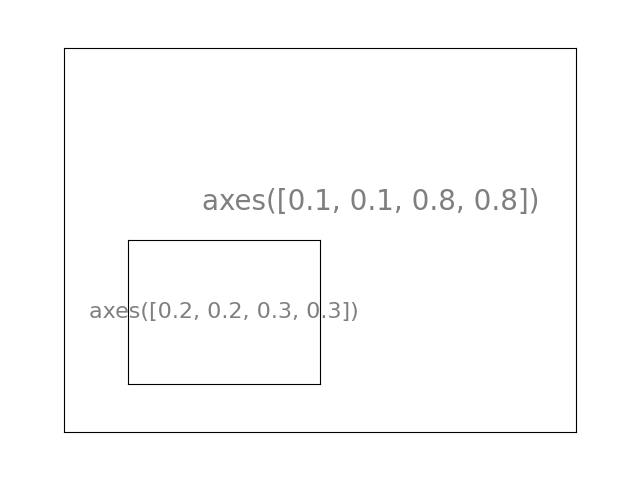
Simple axes example
This example shows a couple of simple usage of axes.
import matplotlib.pyplot as plt

plt.axes((0.1, 0.1, 0.8, 0.8))
plt.xticks([])
plt.yticks([])
plt.text(
    0.6, 0.6, "axes([0.1, 0.1, 0.8, 0.8])", ha="center", va="center", size=20, alpha=0.5
)

plt.axes((0.2, 0.2, 0.3, 0.3))
plt.xticks([])
plt.yticks([])
plt.text(
    0.5, 0.5, "axes([0.2, 0.2, 0.3, 0.3])", ha="center", va="center", size=16, alpha=0.5
)

plt.show()
Total running time of the script: (0 minutes 0.041 seconds)