Note
Go to the end to download the full example code.
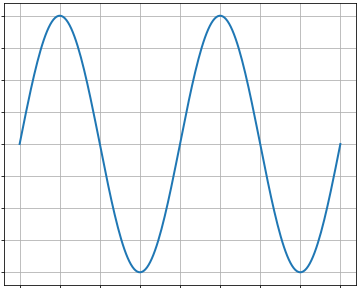
A simple, good-looking plot
Demoing some simple features of matplotlib
import numpy as np
import matplotlib

matplotlib.use("Agg")
import matplotlib.pyplot as plt

fig = plt.figure(figsize=(5, 4), dpi=72)
axes = fig.add_axes((0.01, 0.01, 0.98, 0.98))
X = np.linspace(0, 2, 200)
Y = np.sin(2 * np.pi * X)
plt.plot(X, Y, lw=2)
plt.ylim(-1.1, 1.1)
plt.grid()

plt.show()
Total running time of the script: (0 minutes 0.051 seconds)