Note
Go to the end to download the full example code.
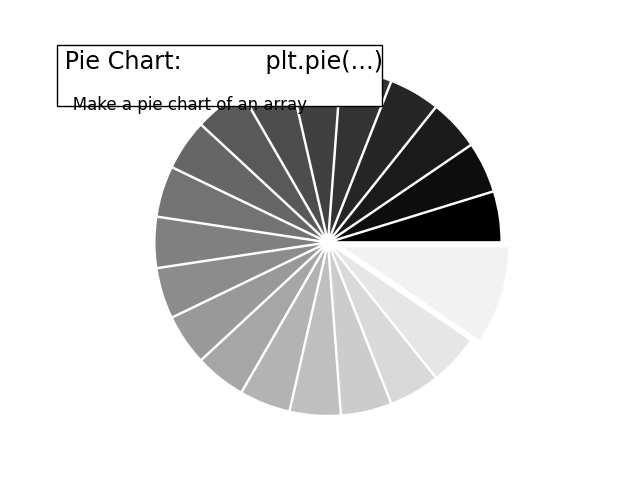
Pie chart vignette
Demo pie chart with matplotlib and style the figure.
import numpy as np
import matplotlib.pyplot as plt

n = 20
X = np.ones(n)
X[-1] *= 2
plt.pie(X, explode=X * 0.05, colors=[f"{i / float(n):f}" for i in range(n)])

fig = plt.gcf()
w, h = fig.get_figwidth(), fig.get_figheight()
r = h / float(w)

plt.xlim(-1.5, 1.5)
plt.ylim(-1.5 * r, 1.5 * r)
plt.xticks([])
plt.yticks([])


# Add a title and a box around it
from matplotlib.patches import FancyBboxPatch

ax = plt.gca()
ax.add_patch(
    FancyBboxPatch(
        (-0.05, 0.87),
        width=0.66,
        height=0.165,
        clip_on=False,
        boxstyle="square,pad=0",
        zorder=3,
        facecolor="white",
        alpha=1.0,
        transform=plt.gca().transAxes,
    )
)

plt.text(
    -0.05,
    1.02,
    " Pie Chart:           plt.pie(...)\n",
    horizontalalignment="left",
    verticalalignment="top",
    size="xx-large",
    transform=plt.gca().transAxes,
)

plt.text(
    -0.05,
    1.01,
    "\n\n   Make a pie chart of an array ",
    horizontalalignment="left",
    verticalalignment="top",
    size="large",
    transform=plt.gca().transAxes,
)

plt.show()
Total running time of the script: (0 minutes 0.053 seconds)