Note
Go to the end to download the full example code.
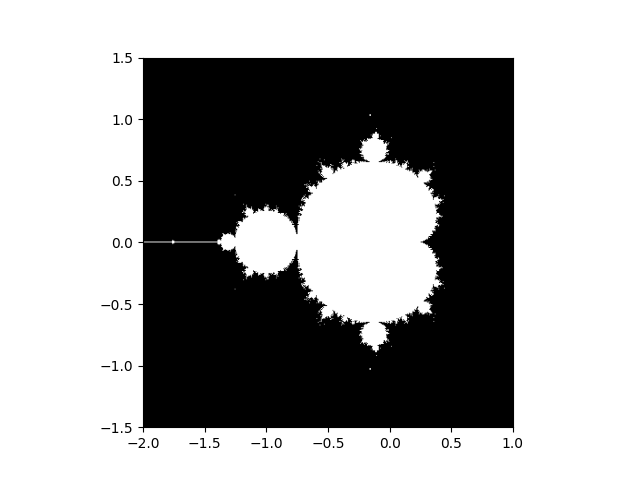
Mandelbrot set
Compute the Mandelbrot fractal and plot it

import numpy as np
import matplotlib.pyplot as plt
from numpy import newaxis
import warnings


def compute_mandelbrot(N_max, some_threshold, nx, ny):
    # A grid of c-values
    x = np.linspace(-2, 1, nx)
    y = np.linspace(-1.5, 1.5, ny)

    c = x[:, newaxis] + 1j * y[newaxis, :]

    # Mandelbrot iteration

    z = c

    # The code below overflows in many regions of the x-y grid, suppress
    # warnings temporarily
    with warnings.catch_warnings():
        warnings.simplefilter("ignore")
        for j in range(N_max):
            z = z**2 + c
        mandelbrot_set = abs(z) < some_threshold

    return mandelbrot_set


mandelbrot_set = compute_mandelbrot(50, 50.0, 601, 401)

plt.imshow(mandelbrot_set.T, extent=(-2, 1, -1.5, 1.5))
plt.gray()
plt.show()
Total running time of the script: (0 minutes 0.080 seconds)