Note
Go to the end to download the full example code.
Reading and writing an elephant
Read and write images
import numpy as np
import matplotlib.pyplot as plt
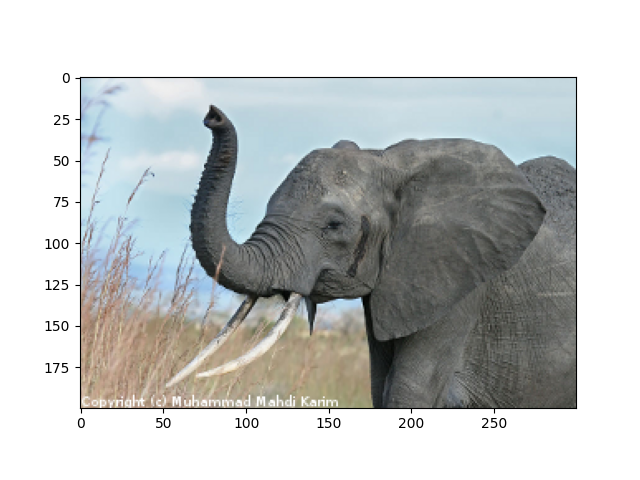
original figure
plt.figure()
img = plt.imread("../../../data/elephant.png")
plt.imshow(img)
<matplotlib.image.AxesImage object at 0x7f3b37add460>
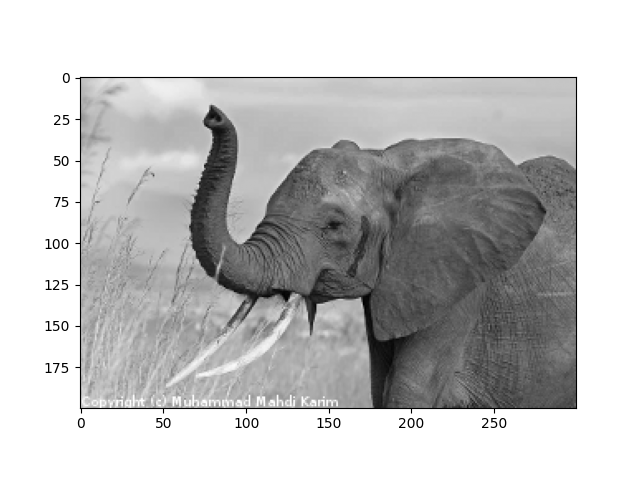
red channel displayed in grey
plt.figure()
img_red = img[:, :, 0]
plt.imshow(img_red, cmap="gray")
<matplotlib.image.AxesImage object at 0x7f3b371659a0>
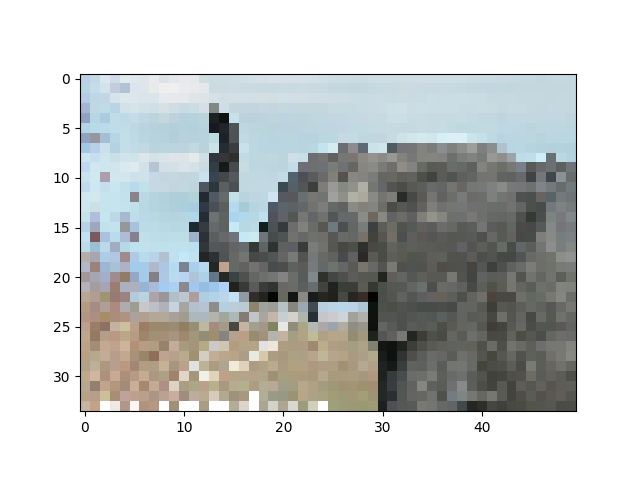
lower resolution
plt.figure()
img_tiny = img[::6, ::6]
plt.imshow(img_tiny, interpolation="nearest")

plt.show()
Total running time of the script: (0 minutes 0.258 seconds)