Note
Go to the end to download the full example code.
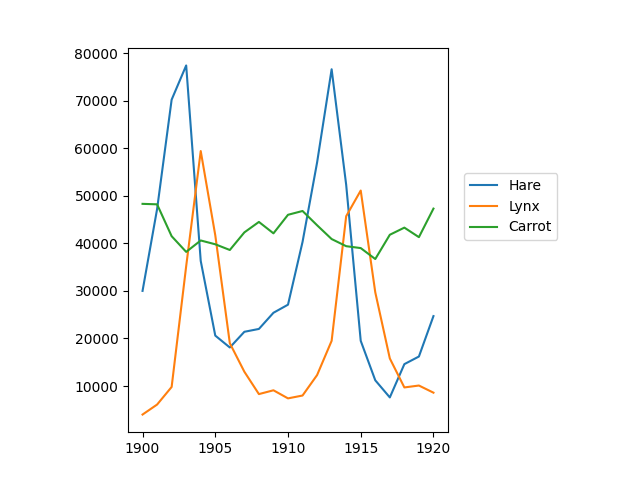
Population exercise
Plot populations of hares, lynxes, and carrots
Total running time of the script: (0 minutes 0.059 seconds)
Note
Go to the end to download the full example code.
Plot populations of hares, lynxes, and carrots
Total running time of the script: (0 minutes 0.059 seconds)