Note
Go to the end to download the full example code.
1.5.12.8. Curve fitting
Demos a simple curve fitting
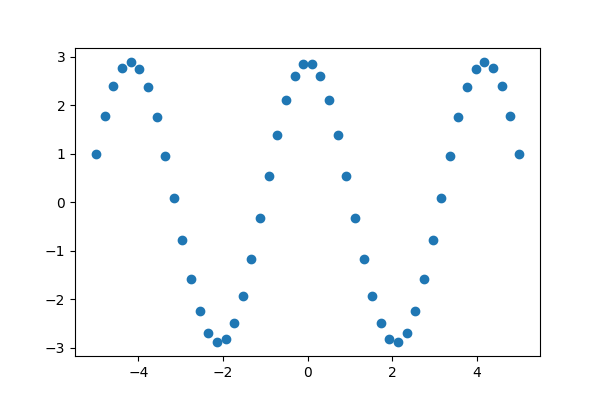
First generate some data
import numpy as np

# Seed the random number generator for reproducibility
rng = np.random.default_rng(27446968)

x_data = np.linspace(-5, 5, num=50)
noise = 0.01 * np.cos(100 * x_data)
a, b = 2.9, 1.5
y_data = a * np.cos(b * x_data) + noise

# And plot it
import matplotlib.pyplot as plt

plt.figure(figsize=(6, 4))
plt.scatter(x_data, y_data)
<matplotlib.collections.PathCollection object at 0x7f3b2c2dea50>
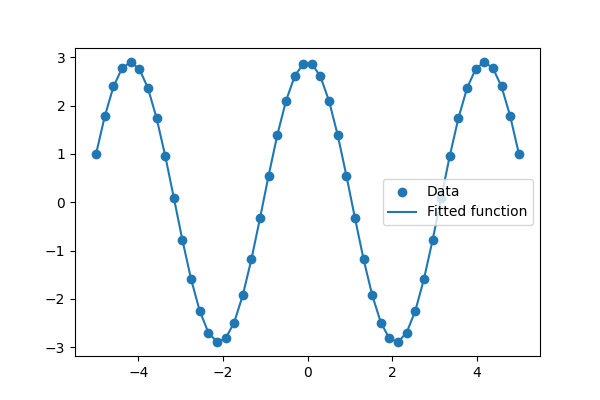
Now fit a simple sine function to the data
[2.900026 1.50012043 1.57079633]
And plot the resulting curve on the data
plt.figure(figsize=(6, 4))
plt.scatter(x_data, y_data, label="Data")
plt.plot(x_data, test_func(x_data, *params), label="Fitted function")

plt.legend(loc="best")

plt.show()
Total running time of the script: (0 minutes 0.105 seconds)