Note
Go to the end to download the full example code.
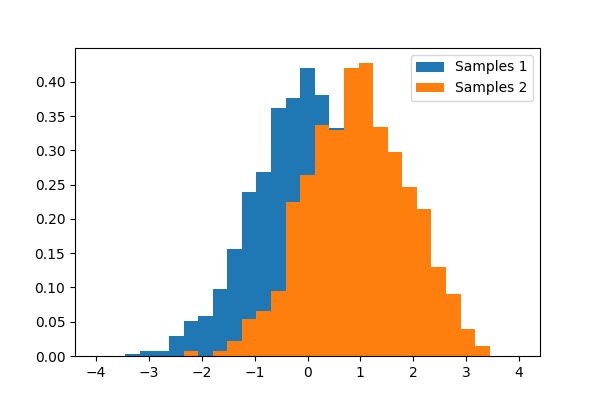
1.5.12.7. Comparing 2 sets of samples from Gaussians
import numpy as np
import matplotlib.pyplot as plt

# Generates 2 sets of observations
rng = np.random.default_rng(27446968)
samples1 = rng.normal(0, size=1000)
samples2 = rng.normal(1, size=1000)

# Compute a histogram of the sample
bins = np.linspace(-4, 4, 30)
histogram1, bins = np.histogram(samples1, bins=bins, density=True)
histogram2, bins = np.histogram(samples2, bins=bins, density=True)

plt.figure(figsize=(6, 4))
plt.hist(samples1, bins=bins, density=True, label="Samples 1")  # type: ignore[arg-type]
plt.hist(samples2, bins=bins, density=True, label="Samples 2")  # type: ignore[arg-type]
plt.legend(loc="best")
plt.show()
Total running time of the script: (0 minutes 0.097 seconds)