Note
Go to the end to download the full example code.
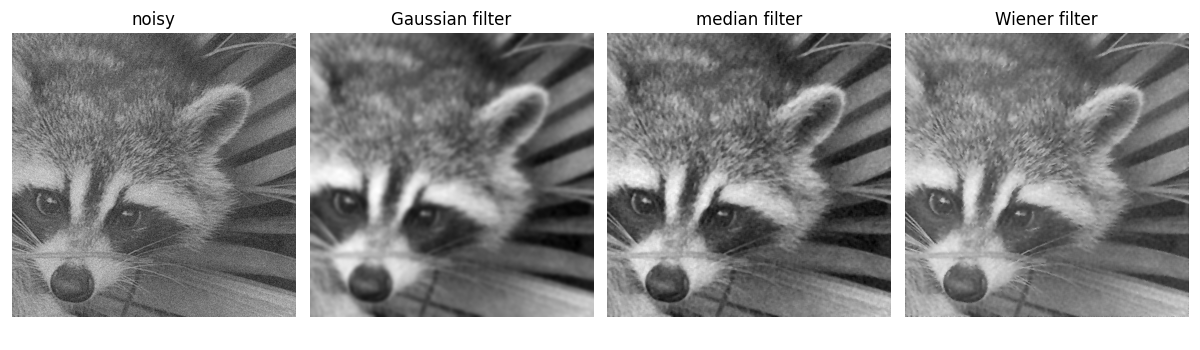
1.5.12.14. Plot filtering on images
Demo filtering for denoising of images.
# Load some data
import scipy as sp

face = sp.datasets.face(gray=True)
face = face[:512, -512:]  # crop out square on right

# Apply a variety of filters
import matplotlib.pyplot as plt

import numpy as np

noisy_face = np.copy(face).astype(float)
rng = np.random.default_rng()
noisy_face += face.std() * 0.5 * rng.standard_normal(face.shape)
blurred_face = sp.ndimage.gaussian_filter(noisy_face, sigma=3)
median_face = sp.ndimage.median_filter(noisy_face, size=5)
wiener_face = sp.signal.wiener(noisy_face, (5, 5))

plt.figure(figsize=(12, 3.5))
plt.subplot(141)
plt.imshow(noisy_face, cmap="gray")
plt.axis("off")
plt.title("noisy")

plt.subplot(142)
plt.imshow(blurred_face, cmap="gray")
plt.axis("off")
plt.title("Gaussian filter")

plt.subplot(143)
plt.imshow(median_face, cmap="gray")
plt.axis("off")
plt.title("median filter")

plt.subplot(144)
plt.imshow(wiener_face, cmap="gray")
plt.title("Wiener filter")
plt.axis("off")

plt.subplots_adjust(wspace=0.05, left=0.01, bottom=0.01, right=0.99, top=0.99)

plt.show()
Total running time of the script: (0 minutes 0.503 seconds)