Note
Go to the end to download the full example code.
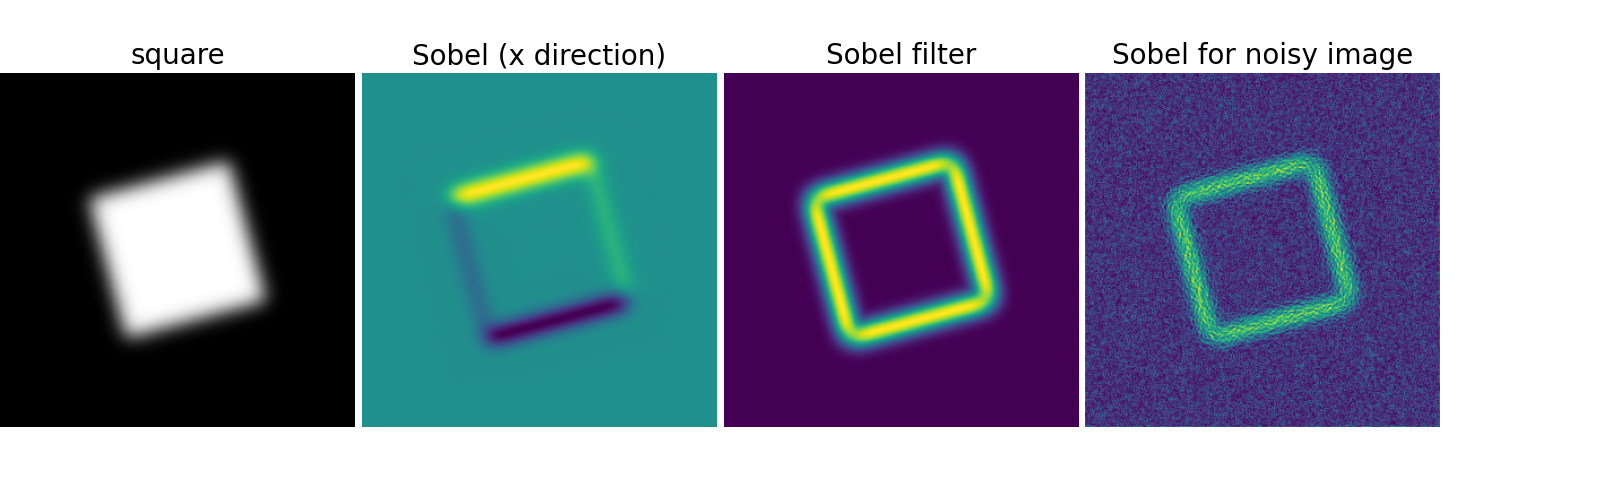
2.6.8.19. Finding edges with Sobel filters
The Sobel filter is one of the simplest way of finding edges.
import numpy as np
import scipy as sp
import matplotlib.pyplot as plt

rng = np.random.default_rng(27446968)

im = np.zeros((256, 256))
im[64:-64, 64:-64] = 1

im = sp.ndimage.rotate(im, 15, mode="constant")
im = sp.ndimage.gaussian_filter(im, 8)

sx = sp.ndimage.sobel(im, axis=0, mode="constant")
sy = sp.ndimage.sobel(im, axis=1, mode="constant")
sob = np.hypot(sx, sy)

plt.figure(figsize=(16, 5))
plt.subplot(141)
plt.imshow(im, cmap="gray")
plt.axis("off")
plt.title("square", fontsize=20)
plt.subplot(142)
plt.imshow(sx)
plt.axis("off")
plt.title("Sobel (x direction)", fontsize=20)
plt.subplot(143)
plt.imshow(sob)
plt.axis("off")
plt.title("Sobel filter", fontsize=20)

im += 0.07 * rng.random(im.shape)

sx = sp.ndimage.sobel(im, axis=0, mode="constant")
sy = sp.ndimage.sobel(im, axis=1, mode="constant")
sob = np.hypot(sx, sy)

plt.subplot(144)
plt.imshow(sob)
plt.axis("off")
plt.title("Sobel for noisy image", fontsize=20)


plt.subplots_adjust(wspace=0.02, hspace=0.02, top=1, bottom=0, left=0, right=0.9)

plt.show()
Total running time of the script: (0 minutes 0.204 seconds)