Note
Go to the end to download the full example code.
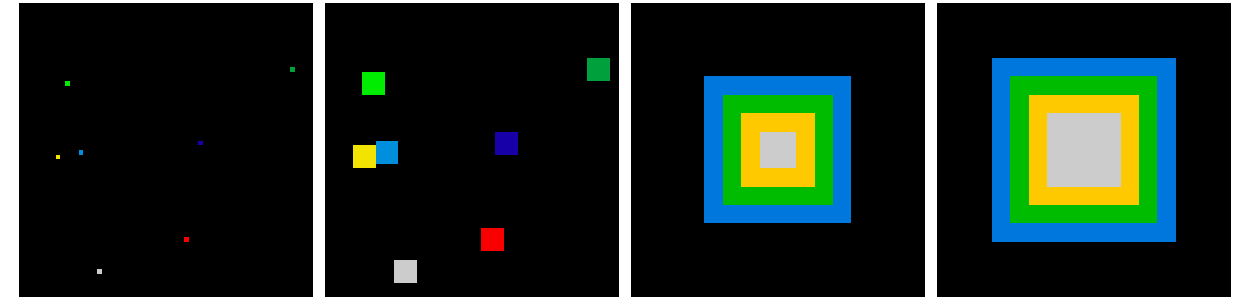
2.6.8.18. Greyscale dilation
This example illustrates greyscale mathematical morphology.
import numpy as np
import scipy as sp
import matplotlib.pyplot as plt

im = np.zeros((64, 64))
rng = np.random.default_rng(27446968)
x, y = (63 * rng.random((2, 8))).astype(int)
im[x, y] = np.arange(8)

bigger_points = sp.ndimage.grey_dilation(im, size=(5, 5), structure=np.ones((5, 5)))

square = np.zeros((16, 16))
square[4:-4, 4:-4] = 1
dist = sp.ndimage.distance_transform_bf(square)
dilate_dist = sp.ndimage.grey_dilation(dist, size=(3, 3), structure=np.ones((3, 3)))

plt.figure(figsize=(12.5, 3))
plt.subplot(141)
plt.imshow(im, interpolation="nearest", cmap="nipy_spectral")
plt.axis("off")
plt.subplot(142)
plt.imshow(bigger_points, interpolation="nearest", cmap="nipy_spectral")
plt.axis("off")
plt.subplot(143)
plt.imshow(dist, interpolation="nearest", cmap="nipy_spectral")
plt.axis("off")
plt.subplot(144)
plt.imshow(dilate_dist, interpolation="nearest", cmap="nipy_spectral")
plt.axis("off")

plt.subplots_adjust(wspace=0, hspace=0.02, top=0.99, bottom=0.01, left=0.01, right=0.99)
plt.show()
Total running time of the script: (0 minutes 0.048 seconds)