Note
Go to the end to download the full example code.
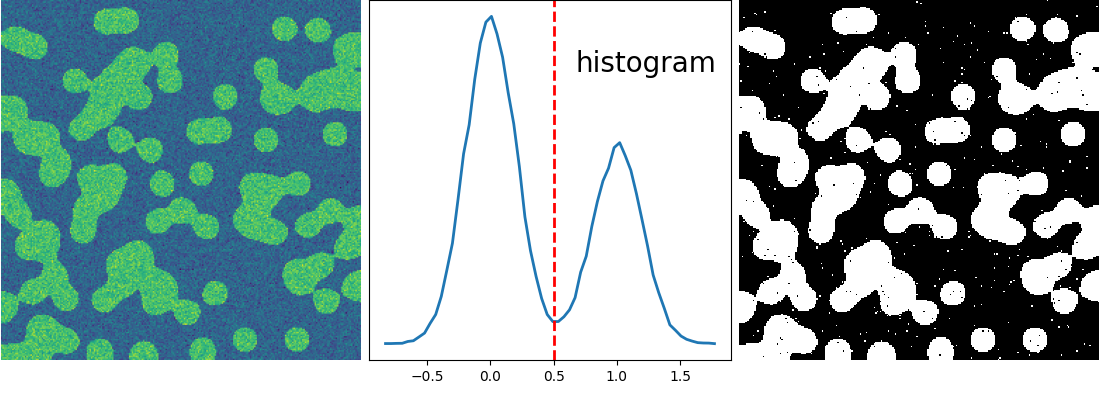
2.6.8.17. Histogram segmentation
This example does simple histogram analysis to perform segmentation.
import numpy as np
import scipy as sp
import matplotlib.pyplot as plt

rng = np.random.default_rng(27446968)
n = 10
l = 256
im = np.zeros((l, l))
points = l * rng.random((2, n**2))
im[(points[0]).astype(int), (points[1]).astype(int)] = 1
im = sp.ndimage.gaussian_filter(im, sigma=l / (4.0 * n))

mask = (im > im.mean()).astype(float)

mask += 0.1 * im

img = mask + 0.2 * rng.normal(size=mask.shape)

hist, bin_edges = np.histogram(img, bins=60)
bin_centers = 0.5 * (bin_edges[:-1] + bin_edges[1:])

binary_img = img > 0.5

plt.figure(figsize=(11, 4))

plt.subplot(131)
plt.imshow(img)
plt.axis("off")
plt.subplot(132)
plt.plot(bin_centers, hist, lw=2)
plt.axvline(0.5, color="r", ls="--", lw=2)
plt.text(0.57, 0.8, "histogram", fontsize=20, transform=plt.gca().transAxes)
plt.yticks([])
plt.subplot(133)
plt.imshow(binary_img, cmap="gray", interpolation="nearest")
plt.axis("off")

plt.subplots_adjust(wspace=0.02, hspace=0.3, top=1, bottom=0.1, left=0, right=1)
plt.show()
Total running time of the script: (0 minutes 0.104 seconds)