Note
Go to the end to download the full example code.
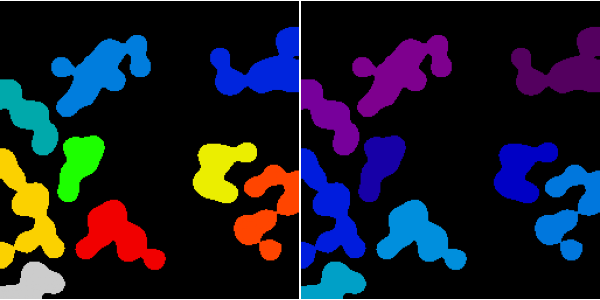
2.6.8.14. Measurements from images
This examples shows how to measure quantities from various images.
import numpy as np
import scipy as sp
import matplotlib.pyplot as plt

rng = np.random.default_rng(27446968)
n = 10
l = 256
im = np.zeros((l, l))
points = l * rng.random((2, n**2))
im[(points[0]).astype(int), (points[1]).astype(int)] = 1
im = sp.ndimage.gaussian_filter(im, sigma=l / (4.0 * n))

mask = im > im.mean()

label_im, nb_labels = sp.ndimage.label(mask)

sizes = sp.ndimage.sum(mask, label_im, range(nb_labels + 1))
mask_size = sizes < 1000
remove_pixel = mask_size[label_im]
label_im[remove_pixel] = 0
labels = np.unique(label_im)
label_clean = np.searchsorted(labels, label_im)


plt.figure(figsize=(6, 3))

plt.subplot(121)
plt.imshow(label_im, cmap="nipy_spectral")
plt.axis("off")
plt.subplot(122)
plt.imshow(label_clean, vmax=nb_labels, cmap="nipy_spectral")
plt.axis("off")

plt.subplots_adjust(wspace=0.01, hspace=0.01, top=1, bottom=0, left=0, right=1)
plt.show()
Total running time of the script: (0 minutes 0.043 seconds)