Note
Go to the end to download the full example code.
Bar plots
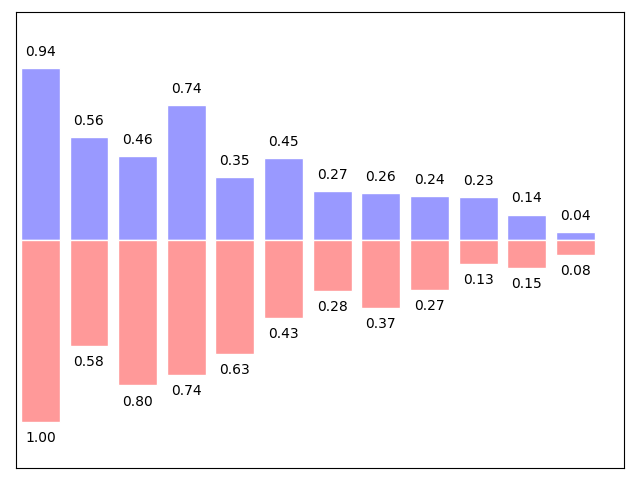
An example of bar plots with matplotlib.

import numpy as np
import matplotlib.pyplot as plt

n = 12
X = np.arange(n)
rng = np.random.default_rng()
Y1 = (1 - X / n) * rng.uniform(0.5, 1.0, n)
Y2 = (1 - X / n) * rng.uniform(0.5, 1.0, n)

plt.axes((0.025, 0.025, 0.95, 0.95))
plt.bar(X, +Y1, facecolor="#9999ff", edgecolor="white")
plt.bar(X, -Y2, facecolor="#ff9999", edgecolor="white")

for x, y in zip(X, Y1):
    plt.text(x, y + 0.05, f"{y:.2f}", ha="center", va="bottom")

for x, y in zip(X, Y2):
    plt.text(x, -y - 0.05, f"{y:.2f}", ha="center", va="top")

plt.xlim(-0.5, n)
plt.xticks([])
plt.ylim(-1.25, 1.25)
plt.yticks([])

plt.show()
Total running time of the script: (0 minutes 0.056 seconds)