Note
Go to the end to download the full example code.
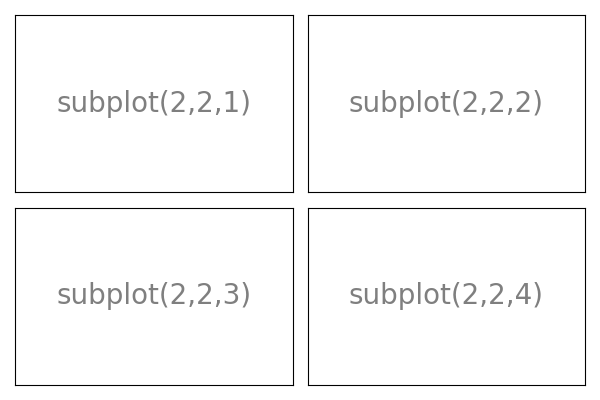
Subplot grid
An example showing the subplot grid in matplotlib.
import matplotlib.pyplot as plt

plt.figure(figsize=(6, 4))
plt.subplot(2, 2, 1)
plt.xticks([])
plt.yticks([])
plt.text(0.5, 0.5, "subplot(2,2,1)", ha="center", va="center", size=20, alpha=0.5)

plt.subplot(2, 2, 2)
plt.xticks([])
plt.yticks([])
plt.text(0.5, 0.5, "subplot(2,2,2)", ha="center", va="center", size=20, alpha=0.5)

plt.subplot(2, 2, 3)
plt.xticks([])
plt.yticks([])

plt.text(0.5, 0.5, "subplot(2,2,3)", ha="center", va="center", size=20, alpha=0.5)

plt.subplot(2, 2, 4)
plt.xticks([])
plt.yticks([])
plt.text(0.5, 0.5, "subplot(2,2,4)", ha="center", va="center", size=20, alpha=0.5)

plt.tight_layout()
plt.show()
Total running time of the script: (0 minutes 0.058 seconds)