Note
Go to the end to download the full example code.
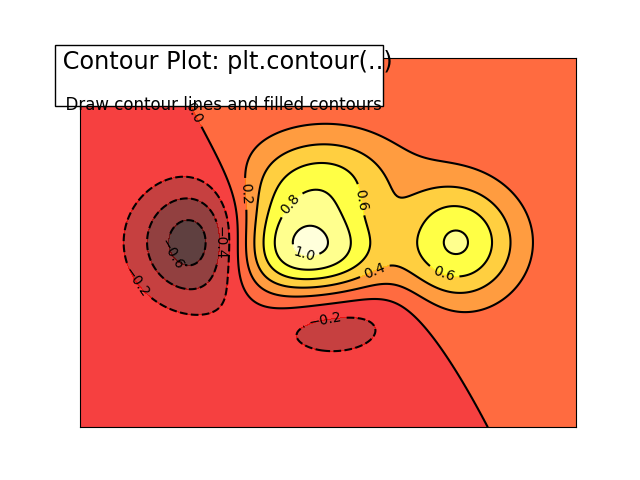
Display the contours of a function
An example demoing how to plot the contours of a function, with additional layout tweaks.
/home/runner/work/scientific-python-lectures/scientific-python-lectures/intro/matplotlib/examples/pretty_plots/plot_contour_ext.py:24: UserWarning: The following kwargs were not used by contour: 'linewidth'
  C = plt.contour(X, Y, f(X, Y), 8, colors="black", linewidth=0.5)
import numpy as np
import matplotlib.pyplot as plt


def f(x, y):
    return (1 - x / 2 + x**5 + y**3) * np.exp(-(x**2) - y**2)


n = 256
x = np.linspace(-3, 3, n)
y = np.linspace(-3, 3, n)
X, Y = np.meshgrid(x, y)

plt.contourf(X, Y, f(X, Y), 8, alpha=0.75, cmap="hot")
C = plt.contour(X, Y, f(X, Y), 8, colors="black", linewidth=0.5)
plt.clabel(C, inline=1, fontsize=10)
plt.xticks([])
plt.yticks([])


# Add a title and a box around it
from matplotlib.patches import FancyBboxPatch

ax = plt.gca()
ax.add_patch(
    FancyBboxPatch(
        (-0.05, 0.87),
        width=0.66,
        height=0.165,
        clip_on=False,
        boxstyle="square,pad=0",
        zorder=3,
        facecolor="white",
        alpha=1.0,
        transform=plt.gca().transAxes,
    )
)

plt.text(
    -0.05,
    1.02,
    " Contour Plot: plt.contour(..)\n",
    horizontalalignment="left",
    verticalalignment="top",
    size="xx-large",
    transform=plt.gca().transAxes,
)

plt.text(
    -0.05,
    1.01,
    "\n\n  Draw contour lines and filled contours ",
    horizontalalignment="left",
    verticalalignment="top",
    size="large",
    transform=plt.gca().transAxes,
)

plt.show()
Total running time of the script: (0 minutes 0.077 seconds)