Note
Go to the end to download the full example code.
Grid elaborate
An example displaying a grid on the axes and tweaking the layout.
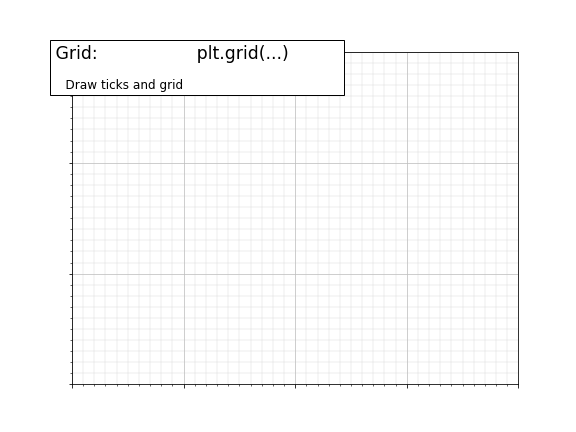
Text(-0.05, 1.01, '\n\n Draw ticks and grid ')
import matplotlib.pyplot as plt
from matplotlib.ticker import MultipleLocator

fig = plt.figure(figsize=(8, 6), dpi=72, facecolor="white")
axes = plt.subplot(111)
axes.set_xlim(0, 4)
axes.set_ylim(0, 3)

axes.xaxis.set_major_locator(MultipleLocator(1.0))
axes.xaxis.set_minor_locator(MultipleLocator(0.1))
axes.yaxis.set_major_locator(MultipleLocator(1.0))
axes.yaxis.set_minor_locator(MultipleLocator(0.1))
axes.grid(which="major", axis="x", linewidth=0.75, linestyle="-", color="0.75")
axes.grid(which="minor", axis="x", linewidth=0.25, linestyle="-", color="0.75")
axes.grid(which="major", axis="y", linewidth=0.75, linestyle="-", color="0.75")
axes.grid(which="minor", axis="y", linewidth=0.25, linestyle="-", color="0.75")
axes.set_xticklabels([])
axes.set_yticklabels([])


# Add a title and a box around it
from matplotlib.patches import FancyBboxPatch

ax = plt.gca()
ax.add_patch(
    FancyBboxPatch(
        (-0.05, 0.87),
        width=0.66,
        height=0.165,
        clip_on=False,
        boxstyle="square,pad=0",
        zorder=3,
        facecolor="white",
        alpha=1.0,
        transform=plt.gca().transAxes,
    )
)

plt.text(
    -0.05,
    1.02,
    " Grid:                  plt.grid(...)\n",
    horizontalalignment="left",
    verticalalignment="top",
    size="xx-large",
    transform=axes.transAxes,
)

plt.text(
    -0.05,
    1.01,
    "\n\n    Draw ticks and grid ",
    horizontalalignment="left",
    verticalalignment="top",
    size="large",
    transform=axes.transAxes,
)
Total running time of the script: (0 minutes 0.099 seconds)