Note
Go to the end to download the full example code.
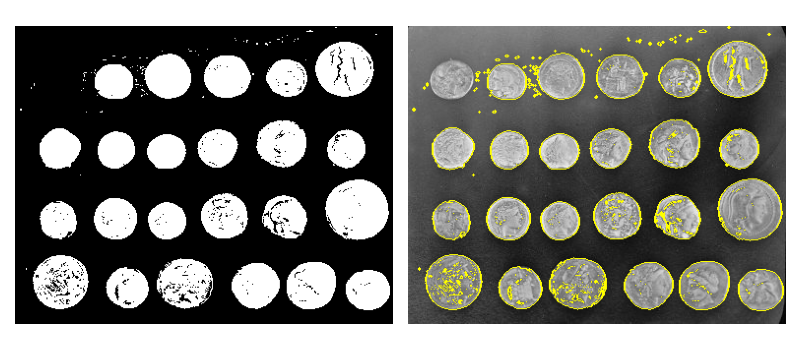
3.3.11.6. Segmentation contours
Visualize segmentation contours on original grayscale image.
from skimage import data, segmentation
from skimage import filters
import matplotlib.pyplot as plt
import numpy as np

coins = data.coins()
mask = coins > filters.threshold_otsu(coins)
clean_border = segmentation.clear_border(mask).astype(int)

coins_edges = segmentation.mark_boundaries(coins, clean_border)

plt.figure(figsize=(8, 3.5))
plt.subplot(121)
plt.imshow(clean_border, cmap="gray")
plt.axis("off")
plt.subplot(122)
plt.imshow(coins_edges)
plt.axis("off")

plt.tight_layout()
plt.show()
Total running time of the script: (0 minutes 0.096 seconds)