Note
Go to the end to download the full example code.
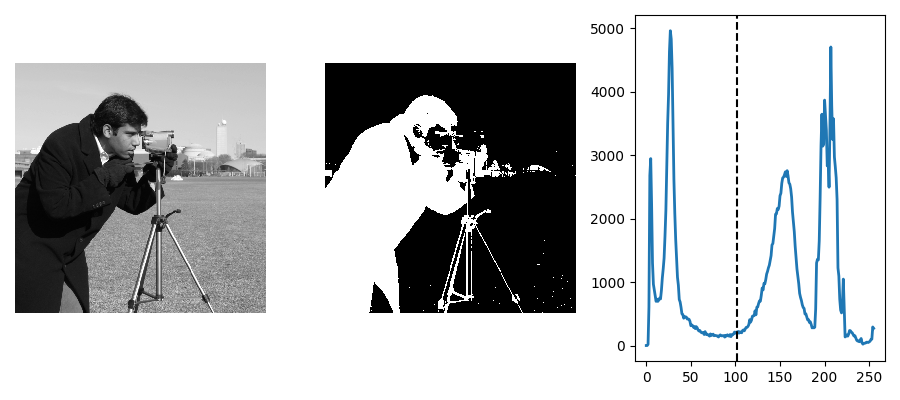
3.3.11.7. Otsu thresholding
This example illustrates automatic Otsu thresholding.
import matplotlib.pyplot as plt
from skimage import data
from skimage import filters
from skimage import exposure

camera = data.camera()
val = filters.threshold_otsu(camera)

hist, bins_center = exposure.histogram(camera)

plt.figure(figsize=(9, 4))
plt.subplot(131)
plt.imshow(camera, cmap="gray", interpolation="nearest")
plt.axis("off")
plt.subplot(132)
plt.imshow(camera < val, cmap="gray", interpolation="nearest")
plt.axis("off")
plt.subplot(133)
plt.plot(bins_center, hist, lw=2)
plt.axvline(val, color="k", ls="--")

plt.tight_layout()
plt.show()
Total running time of the script: (0 minutes 0.131 seconds)